The Business Clarity System That Turns Your Scattered Business Data Into Clear, Actionable Insights
So You Can Make Better Decisions For Business Growth— Without Guessing.
See What We've Built For Real Business Needs
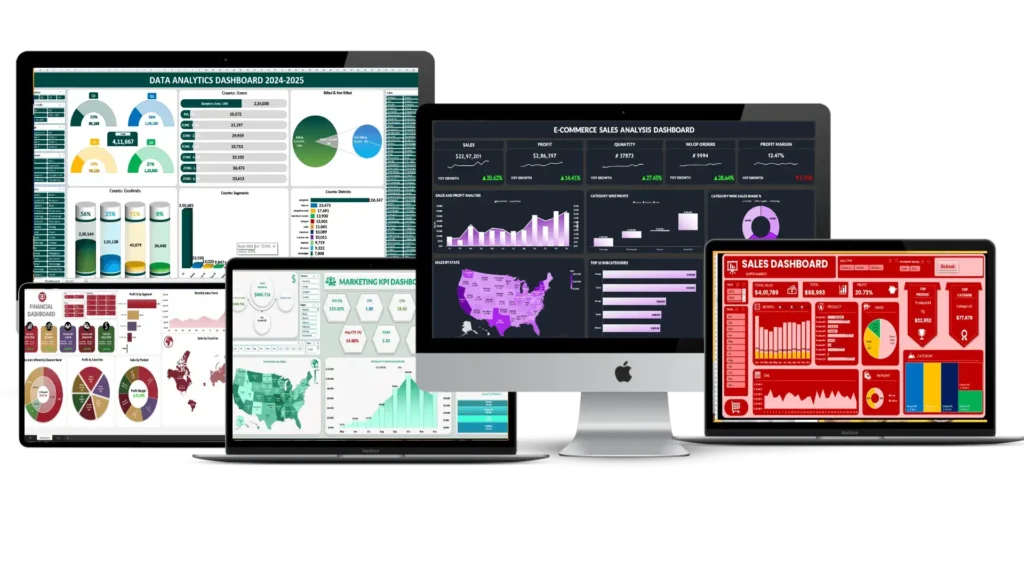
From sales and revenue to marketing, operations, finance, and team performance — each dashboard is built around the KPIs and decisions matter to that particular business.
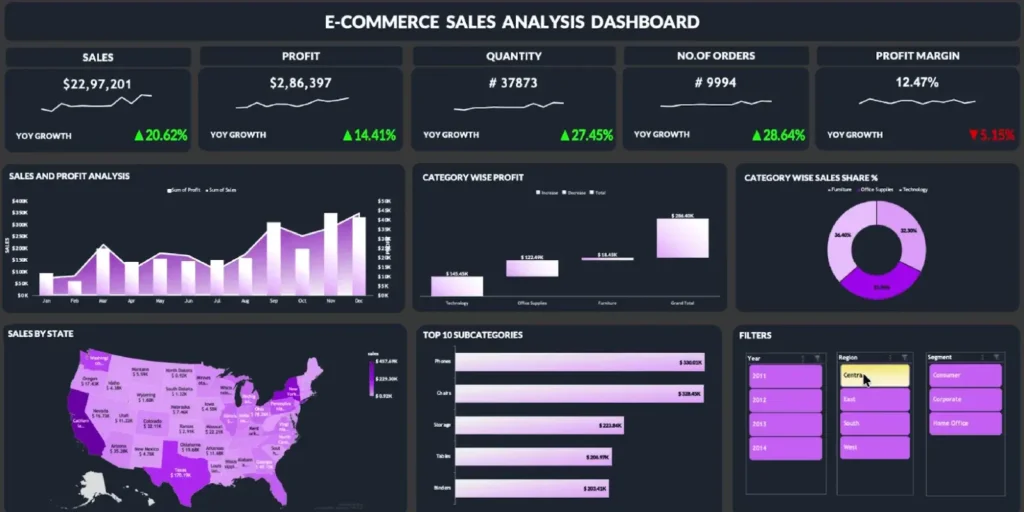
E-Commerce Sales Dashboard
- Revenue, profit & margins
- Best-selling products & categories
- Orders & sales trends
- Product & category performance
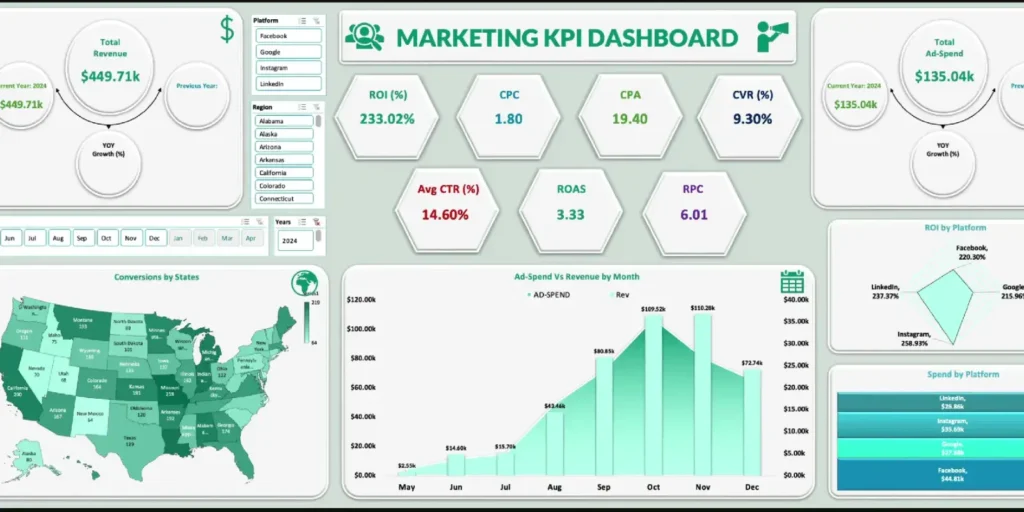
Marketing KPI Dashboard
- Ad spend & revenue
- ROAS, ROI, CPC & CPA
- Leads, conversions & CTR
- Performance by platform & campaign
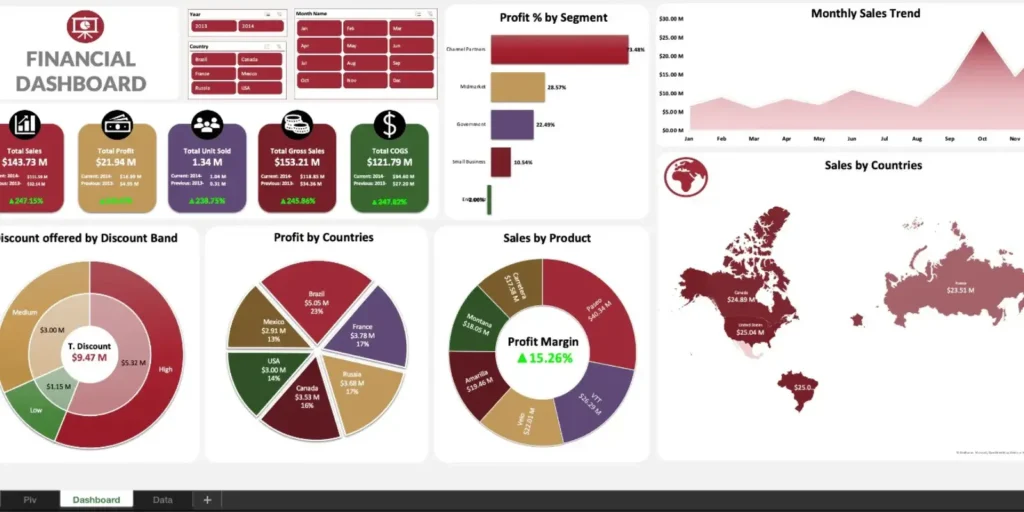
Financial KPI Dashboard
- Revenue, profit & profit margins
- Sales & profitability by country
- Product & segment performance
- Financial trends over time
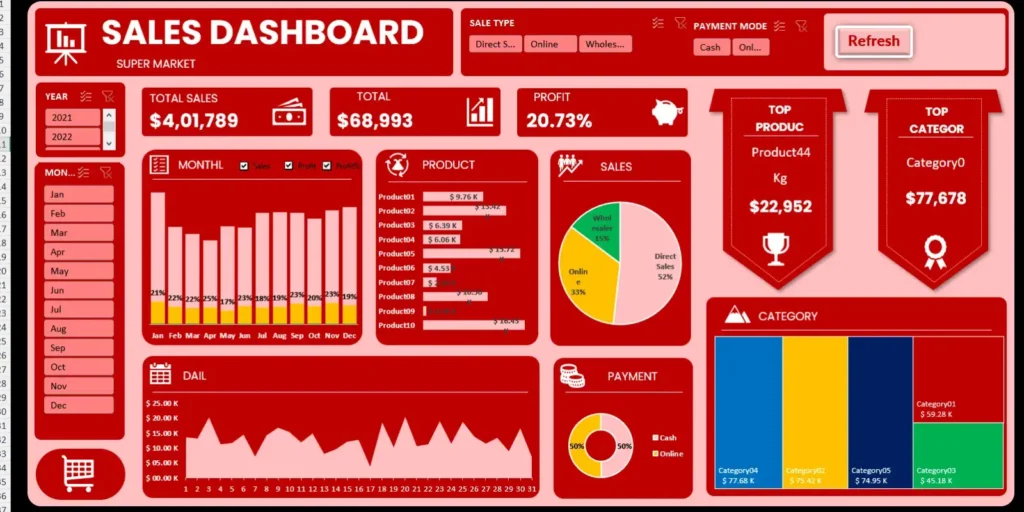
Super Market Sales Dashboard
- Total sales & profit performance
- Top-performing products & categories
- Daily & monthly sales trends
- Year & month performance
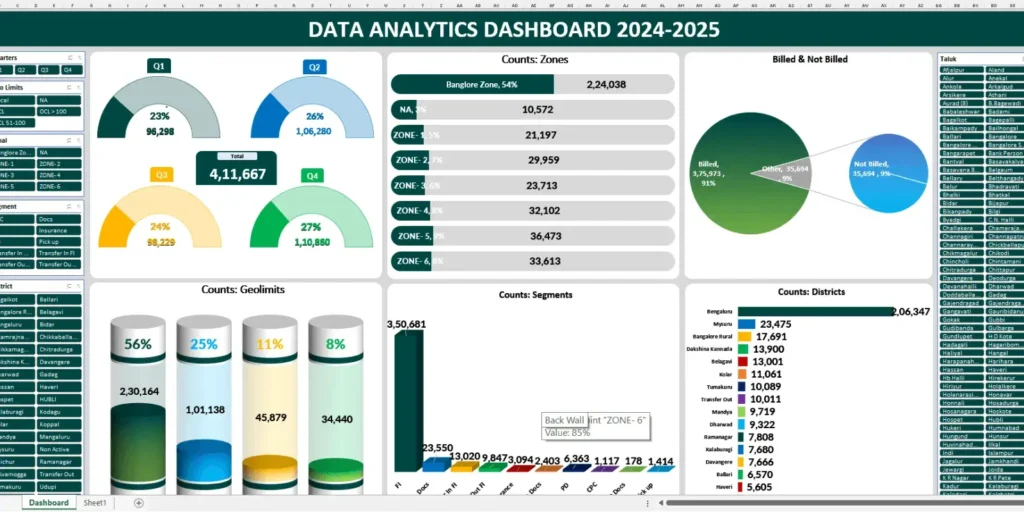
Data Analytics Dashboard
- Performance across regions, zones & districts
- Segment-wise volume & contribution
- Quarterly & period-over-period performance
- Geographic & operational distribution
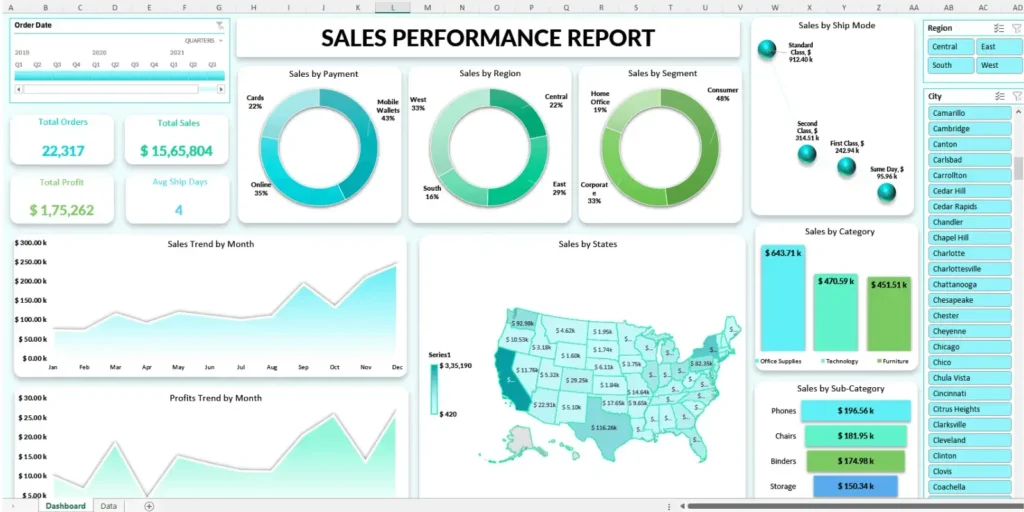
Sales Performance Report
- Sales by region, state & segment
- Payment & shipping performance
- Monthly sales & profit trends
- Category & sub-category performance
Please Check All Boxes Where Your Answer is YES!
If You Checked ANY Of The Boxes Above, You’re Exactly Who We Build This For.
“INTERACTIVE DASHBOARD”
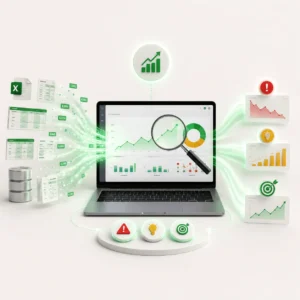
How We Turn Your Business Data Into A Clear Decision-Making System. So You Always Know What's Working, What's Not & What To Do Next
Imagine opening one dashboard and instantly seeing how your business is performing.
Not digging through multiple spreadsheets.
Not jumping between different platforms trying to piece the numbers together.
Not spending hours compiling reports just to figure out what actually matters.
Just clarity.
A clear view of the numbers that matter — and the insights you need to make smarter decisions.
Because having more data doesn’t necessarily mean having more clarity.
Our Interactive Dashboard brings your most important business data together into a custom dashboard built around the way your business actually operates.
We take care of everything:
→ Your data structure — so the right information is organized in one place.
→ Your KPIs & metrics — so you can quickly see what deserves your attention.
→ Your dashboard design — so complex numbers become simple, easy-to-understand insights.
→ Your reporting needs — so you spend less time compiling numbers and more time acting on them.
You don’t need another spreadsheet full of numbers.
You need to know:
→ What’s working.
→ What’s not.
→ Where you’re losing money.
→ Where the opportunity is.
→ And what deserves your attention next.
That’s what we build.
And the best part?
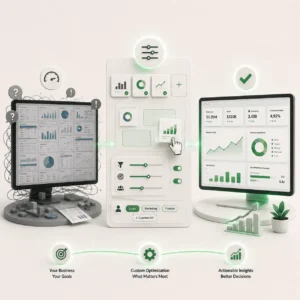
Your dashboard is custom-built around your business — not some generic template you’re forced to squeeze your numbers into.
Whether you need to track sales, revenue, profit, marketing performance, team performance, inventory, or other critical KPIs, we build the system around the information you actually need to run the business.
So instead of asking:
“What the hell is happening with my numbers?”
You can open your dashboard and see it.
Ready to turn your data into clarity?
Book a call below, and we’ll show you how we can build a Business Clarity System around your business.
We’ll look at how you’re currently tracking your numbers, what’s making reporting difficult, and what your ideal dashboard could look like.
See How Business Owners Are Using This To Gain Financial Clarity!
Customers Rated It 4.8/5
How It Works
Set It Up Once
Download the system and customize your dashboard with your business details, categories, accounts & settings. Takes just minutes.
Enter Your Data Daily
Record your sales, expenses & transactions in one simple sheet. No Excel expertise required
Watch Every Report Update Automatically
Your reports, KPIs & dashboards update instantly — so you always know what’s happening in your business.
No Complicated Software.
Runs in a simple, structured system you control.
No Subscriptions.
One-time payment. Lifetime access.
No Data Expertise Needed
Get clear insights from your numbers without becoming a data analyst.
The Business Clarity System
100% Done-for-you!!!
DATA ORGANIZATION & STRUCTURE
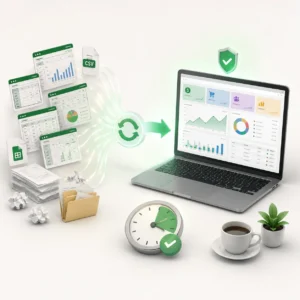
We organize your business data into a clean, structured system so you can stop hunting through scattered files and reports.
KPI & METRIC SETUP
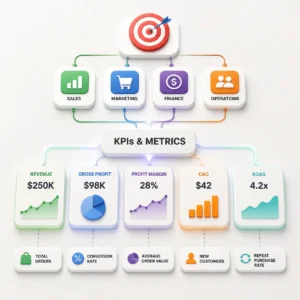
We organize your business data into a clean, structured system so you can stop hunting through scattered files and reports.
CUSTOM DASHBOARD BUILD
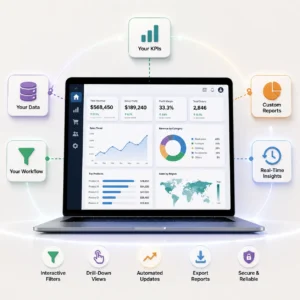
We build a custom dashboard around your business, your KPIs, and the way you actually operate.
AUTOMATED REPORTING
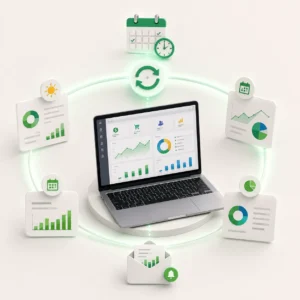
We simplify your reporting process so you spend less time compiling numbers and more time acting on them.
DATA ANALYSIS & INSIGHTS
We turn your raw numbers into clear visual insights that help you spot trends, problems, opportunities, and performance gaps.
DASHBOARD OPTIMIZATION
We refine the dashboard around your requirements and KPIs so it stays useful as your business evolves.
9 Reasons Businesses
Choose Our Business Clarity System
More than a dashboard. A clearer way to understand and run your business.
Built Around
Your Business
We don't force your numbers into a generic template. Your dashboard is built around your KPIs, data, and the way your business actually operates.
100%
Done-For-You
You don't need to figure out formulas, layouts, charts, or reporting structures. We handle the heavy lifting from start to finish.
No Complicated
Software
No bloated platforms with dozens of features you'll never use. Just a clear, structured system designed to make your numbers easier to understand.
No Monthly
Dashboard Subscription
Get the visibility you need without adding another recurring software bill to your business.
Focus On The
Numbers That Matter
Instead of drowning in hundreds of metrics, your dashboard puts the KPIs that actually matter front and center.
Clear, Actionable
Insights
We don't just make your data look pretty. We structure it so you can quickly see what's working, what's not, and where to focus next.
Works With Your
Existing Data
Your information may live across spreadsheets, platforms, or different systems. We work with the data you already have and bring the important pieces together.
Built To Grow
With Your Business
As your business changes, your reporting needs change too. Your dashboard can evolve with your KPIs, products, teams, and operations.
Expert Support
When You Need It
You're not left staring at a dashboard wondering what to do next. We're here to help you understand and get the most from the system.
What Makes Technoverse Special !!!
There are countless accounting tools, spreadsheets, and subscriptions out there.
Most are either too complex, too expensive, or too fragmented.
This system was built for business owners who want clarity without hiring a team or paying monthly software fees.
All Your Questions Answered!
No.
We don’t hand you a generic dashboard and expect you to figure out how to make it work for your business. We’ll first understand your business, what you need to track, and which KPIs actually matter to you — then build the dashboard around those requirements.
We’ll discuss how you’re currently tracking your business, where your data comes from, what you’re struggling to see clearly, and what you want the dashboard to help you accomplish. From there, we’ll determine what should be included in your custom dashboard.
No. You don’t need to be an Excel expert or know how to build dashboards yourself. That’s what we’re here for. We handle the structure, formulas, reporting logic, and dashboard design so the finished system is easy for you to understand and use.
Yes. That’s the entire point. Your dashboard isn’t based on a fixed list of metrics. We’ll identify the KPIs that are important to your business and build the system around the information you actually need to monitor.
That’s expected. Different businesses track different numbers, operate differently, and have different reporting needs. That’s why we don’t use a one-size-fits-all dashboard. We start by understanding how your business works and then build accordingly.
Not necessarily. We work with the data and systems you already use wherever possible. During the strategy call, we’ll look at where your data currently lives and determine the best way to structure it for your dashboard.
The dashboard is designed to make the important information easier to see and understand — what’s performing well, what’s changing, where problems may exist, and where opportunities may be worth investigating. The goal isn’t to give you more numbers. It’s to give you clearer information for better decisions.
The goal is the opposite. We build the system to be practical and easy to use based on your requirements. Exactly how the dashboard is maintained or updated will depend on the data sources and setup we agree on during the process.
Because every dashboard is built around the client’s specific requirements, the scope can vary. We’ll first understand what you need and what we’re building before discussing the appropriate investment.
Ready To Turn Your Messy Data Into Clear Insights That Help You Grow Your Business?
Stop guessing and start making better decisions with a clear view of the numbers that actually matter.
This site is not part of the Facebook website or Facebook Inc. Additionally, this site is NOT endorsed by Facebook in any way. FACEBOOK is a trademark of FACEBOOK, Inc.
Privacy Policy | Terms | Contact | Cancellation & Refund Policy